
We all know that Google helps you to know everything but how about Google from now on will help you to even understand everything. Its just next level of awesomeness which Google have launched today, i.e Google Databoard.
Many a times small businesses struggle to get consumer behavior data and to get answers to the survey questions asked which nobody answers. You might want to know how consumer uses their mobiles to buy stuff online, if you just knew the expected behavior then, you might be able to convert more sales. But where do you find such data, before Google’s Databoard you would have to either buy it from some data company or gather it all by yourself.
So what is Google Databoard?
The Databoard is a collection of Google studies related to consumer mobile behavior. The cool thing is the format of the data. It’s arranged in a logical hierarchy that you can easily browse. If you find a particular piece of data that you like you can “clip” that data and add it to an info-graphic called a Databoard. You can even download the research study for sharing with your friends, customers and co-workers.
The data comes from various studies on the Think Insights site. Most of the studies are done with a partner, like Nielsen. They span across industries, like retail, advertising, education, fashion, healthcare and travel, as well as different demographics. Try out the Google Databoard here
How to use Google Databoard for your business?
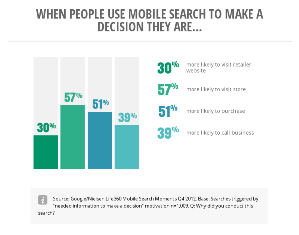
I would say it depends on your creativity completely, but to give an example – imagine you have a retail store, and you want to focus on entire retail process, like customer acquisition, engagements and conversion for your retail products. To think in broader sense you would first like to know what is it that your customer uses to buy things online(mobile, laptops, PC etc), or what is it that they browse on internet, and what is it that they browse when there are inside retail stores. See the image for one such data point.
Whenever you find a relevant information which you are looking for you can add the box to “Add to Infographic” and make your own infographic which you can share with ease. I have made an infographic with above mentioned three data points which you can access from Startupfreak’s Google Databoard profile.
While the Google tool only includes a handful of studies right now, Google intends to update it with new research frequently. It will be nice if Google partners with some of the leading research firms to expand this tool, and if that happens and Google is able to collect huge number of data sets and verticals then this tool can grow to become a research tool from being just a PR and marketing tool.
Whether you are a big or small company, real marketing plan has to start with real data and real facts, this tool will surely give you a direction when Sketching out your marketing plans.


